The Weather of June 2020
Mainly attributing to the stronger than usual subtropical ridge over southern China, June 2020 was much hotter than usual in Hong Kong. The monthly mean minimum temperature was 27.8 degrees, 1.6 degrees above the normal figure and the highest on record for June. The monthly mean temperature and monthly mean maximum temperature were 29.6 degrees and 32.3 degrees respectively, both were the second highest on record for June. With a total of 18 hot nights, June 2020 was on par with July 1993 as one of the highest record of number of hot nights in a month. The 12 consecutive hot nights that started from 19 June also set a new record for June. Moreover, the first half of this year was exceptionally warm. The mean maximum temperature of 25.7 degrees and mean temperature of 23.0 degrees were both the highest on record for the same period. The mean minimum temperature of 21.1 degrees was the third highest on record for the same period. June 2020 was also marked by sunny weather with the monthly total sunshine duration amounting to 192.5 hours, about 32 percent above the normal of 146.1 hours. Despite the heavy rain episode on 6 – 8 June, the monthly total rainfall was only 397.2 millimetres, about 13 percent below the normal figure of 456.1 millimetres. The accumulated rainfall for the first half of the year of 963.4 millimetres was about 12 percent below the normal figure of 1096.9 millimetres.
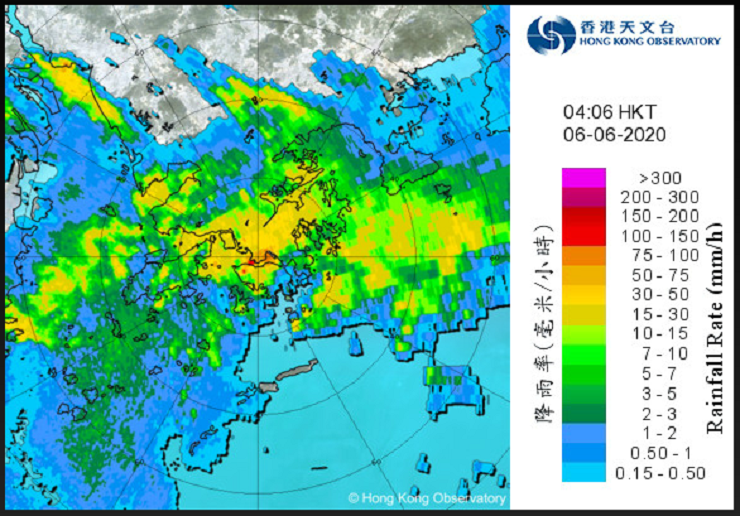
Under the influence of an anticyclone aloft, the weather of Hong Kong was hot with a mixture of sunshine and showers on the first five days of the month. There were also isolated thunderstorms on 2, 4 and 5 June. Affected by a trough of low pressure lingering over the coastal areas of Guangdong, local weather deteriorated with outbreaks of heavy showers and squally thunderstorms on 6 – 8 June. More than 250 millimetres of rainfall were recorded over most parts of the territory and rainfall even exceeded 450 millimetres over Tsuen Wan, Sha Tin, Tai Po and Sai Kung during these three days. There were reports of serious flooding in the New Territories and parts of Kowloon. The rain was particularly heavy on the morning of 6 June and the incessant downpour necessitated the issuance of the Black Rainstorm Warning, the first time since May 2017. More than 14350 cloud-to-ground lightning strokes were detected in Hong Kong on that day, the second highest on record since the launch of the lightning location system in 2005. Moreover, waterspout was reported near the Hong Kong International Airport on the morning of 8 June.
With the trough of low pressure moving away and the strengthening of an anticyclone aloft, showery activities decreased with sunny intervals during the day on 9 June. Apart from isolated showers, local weather gradually became fine and very hot on 10 – 12 June. With plenty of sunshine, the maximum temperature at the Observatory soared to 35.0 degrees on 12 June, the highest of the month.
Meanwhile, an area of low pressure developed into a tropical depression over the Philippines on the morning of 12 June and later named as Nuri. It moved generally northwestward across the South China Sea during the day and further intensified into a tropical storm in the small hours of 13 June. The weather of Hong Kong was very hot with sunny periods on 13 June. There were also a few squally showers and isolated thunderstorms. Affected by Nuri, local winds started to strengthen gradually in the afternoon and became fresh to strong southeasterlies with occasionally gales on high ground that night. As Nuri made landfall over Yangjiang of Guangdong later in the morning on 14 June and weakened gradually into an area of low pressure over inland, winds over Hong Kong moderated with sunny intervals in the afternoon. A person was tragically drowned in the rough seas while surfing in Lower Cheung Sha Beach of Lantau Island on 14 June.
Under the influence of a southerly airstream, local weather was hot with a mixture of sunny periods and showers on 15 – 17 June. Dominated by the subtropical ridge, apart from isolated showers, it was generally fine and hot for the next week. Under the influence of the southwest monsoon, the weather turned slightly cloudier with isolated showers and thunderstorms on 25 – 27 June. With the strengthening of the anticyclone aloft, the weather turned generally fine and very hot apart from isolated showers towards the end of the month.
One tropical cyclone occurred over the South China Sea and the western North Pacific in June 2020.

Serious flooding in Kwun Tong Road on the morning of 6 June 2020

Serious flooding in Sai Kung on the morning of 6 June 2020
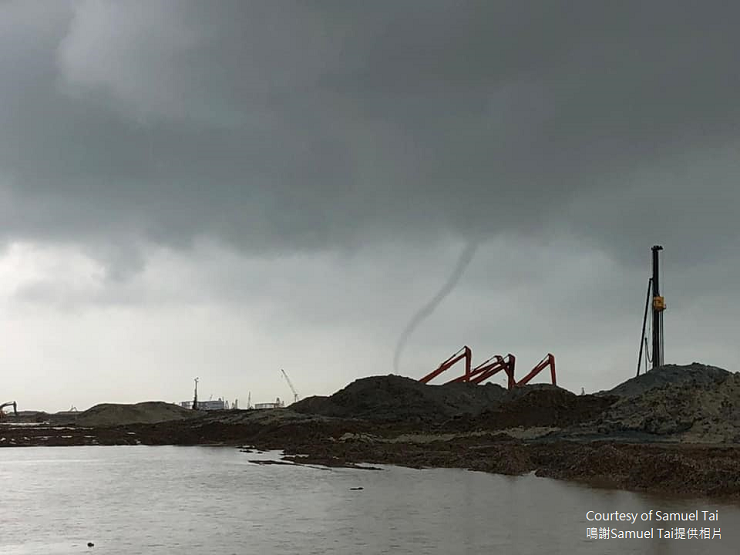
Waterspout was reported near the Hong Kong International Airport on the morning of 8 June 2020
Warnings and Signals issued in June 2020
| Name of Tropical Cyclone |
Signal Number |
Beginning Time | Ending Time | ||
|---|---|---|---|---|---|
| Day/Month | HKT | Day/Month | HKT | ||
| NURI | 1 | 12 / 6 | 2020 | 13 / 6 | 1540 |
| 3 | 13 / 6 | 1540 | 14 / 6 | 1040 | |
| 1 | 14 / 6 | 1040 | 14 / 6 | 1320 | |
| Colour | Beginning Time | Ending Time | ||
|---|---|---|---|---|
| Day/Month | HKT | Day/Month | HKT | |
| Amber | 6 / 6 | 0040 | 6 / 6 | 0130 |
| Red | 6 / 6 | 0130 | 6 / 6 | 0255 |
| Black | 6 / 6 | 0255 | 6 / 6 | 0540 |
| Red | 6 / 6 | 0540 | 6 / 6 | 0630 |
| Amber | 6 / 6 | 0630 | 6 / 6 | 0805 |
| Amber | 7 / 6 | 0620 | 7 / 6 | 0730 |
| Red | 7 / 6 | 0730 | 7 / 6 | 1100 |
| Amber | 7 / 6 | 1100 | 7 / 6 | 1235 |
| Amber | 8 / 6 | 0855 | 8 / 6 | 1115 |
| Beginning Time | Ending Time | ||
|---|---|---|---|
| Day/Month | HKT | Day/Month | HKT |
| 6 / 6 | 0445 | 7 / 6 | 1700 |
| Beginning Time | Ending Time | ||
|---|---|---|---|
| Day/Month | HKT | Day/Month | HKT |
| 2 / 6 | 0025 | 2 / 6 | 0315 |
| 2 / 6 | 0627 | 2 / 6 | 0745 |
| 2 / 6 | 0940 | 2 / 6 | 1715 |
| 2 / 6 | 1835 | 2 / 6 | 1920 |
| 3 / 6 | 0510 | 3 / 6 | 0615 |
| 4 / 6 | 1635 | 4 / 6 | 1830 |
| 5 / 6 | 1000 | 5 / 6 | 1130 |
| 5 / 6 | 2325 | 6 / 6 | 1055 |
| 6 / 6 | 1211 | 6 / 6 | 1330 |
| 6 / 6 | 1555 | 6 / 6 | 2000 |
| 7 / 6 | 0220 | 7 / 6 | 1500 |
| 7 / 6 | 1510 | 7 / 6 | 1800 |
| 8 / 6 | 0340 | 8 / 6 | 1700 |
| 9 / 6 | 1030 | 9 / 6 | 1230 |
| 13 / 6 | 0326 | 13 / 6 | 0600 |
| 13 / 6 | 0935 | 13 / 6 | 1130 |
| 13 / 6 | 1610 | 13 / 6 | 1845 |
| 14 / 6 | 1700 | 14 / 6 | 1900 |
| 14 / 6 | 2210 | 14 / 6 | 2330 |
| 26 / 6 | 0937 | 26 / 6 | 1045 |
| 26 / 6 | 1145 | 26 / 6 | 1400 |
| 27 / 6 | 1208 | 27 / 6 | 1320 |
| Beginning Time | Ending Time | ||
|---|---|---|---|
| Day/Month | HKT | Day/Month | HKT |
| 4 / 6 | 0940 | 4 / 6 | 1620 |
| 11 / 6 | 1215 | 13 / 6 | 1800 |
| 16 / 6 | 0745 | 16 / 6 | 1400 |
| 18 / 6 | 1130 | 18 / 6 | 1730 |
| 19 / 6 | 0745 | 19 / 6 | 1800 |
| 22 / 6 | 0645 | 22 / 6 | 1845 |
| 23 / 6 | 1100 | 23 / 6 | 1815 |
| 24 / 6 | 1350 | 24 / 6 | 1800 |
| 28 / 6 | 1115 | 28 / 6 | 1815 |
| 29 / 6 | 1145 | 1 / 7 | 1630 |
| Beginning Time | Ending Time | ||
|---|---|---|---|
| Day/Month | HKT | Day/Month | HKT |
| 6 / 6 | 0145 | 6 / 6 | 0805 |
| 7 / 6 | 1000 | 7 / 6 | 1235 |
| Meteorological Element | Figure of the Month | Departure from Normal* |
|---|---|---|
| Mean Daily Maximum Air Temperature | 32.3 degrees C | 2.1 degrees above normal |
| Mean Air Temperature | 29.6 degrees C | 1.7 degrees above normal |
| Mean Daily Minimum Air Temperature | 27.8 degrees C | 1.6 degrees above normal |
| Mean Dew Point Temperature | 25.4 degrees C | 0.8 degree above normal |
| Mean Relative Humidity | 79 % | 3 % below normal |
| Mean Cloud Amount | 76 % | 1 % below normal |
| Total Rainfall | 397.2 mm | 58.9 mm below normal |
| Number of hours of Reduced VisibilityΔ | 0 hour | 15.4 hours below normal§ |
| Total Bright Sunshine Duration | 192.5 hours | 46.4 hours above normal |
| Mean Daily Global Solar Radiation | 18.46 Megajoule / square metre | 4.27 Megajoule above normal |
| Total Evaporation | 119.2 mm | 2.1 mm above normal |
| Remarks : | All measurements were made at the Hong Kong Observatory except sunshine, solar radiation and evaporation which were recorded at King's Park Meteorological Station and visibility which was observed at the Hong Kong International Airport. |
| Δ |
The visibility readings at the Hong Kong International Airport are based on hourly observations by professional meteorological observers in 2004 and before, and average readings over the 10-minute period before the clock hour of the visibility meter near the middle of the south runway from 2005 onwards. The change of the data source in 2005 is an improvement of the visibility assessment using instrumented observations following the international trend. |
* Departure from 1981 - 2010 climatological normal, except for number of hours of reduced visibility |
|
§ Departure from mean value between 1997 and 2019 |
|


| Remarks : | Extremely high: above 95th percentile Above normal: between 75th and 95th percentile Normal: between 25th and 75th percentile Below normal: between 5th and 25th percentile Extremely low: below 5th percentile Percentile and 5-day running average values are computed based on the data from 1981 to 2010 |
