How to interpret computer model weather forecasts?
How to Interpret Computer Model Weather Forecasts?
Leung Yu-ting and Ho Wai-hong
December 2025
Computer weather prediction models are essential tools for weather forecasting over the next few days. In addition to traditional numerical weather prediction (NWP) models, there has been rapid development in weather prediction using artificial intelligence (AI) in recent years. In light of this, the Observatory has progressively incorporated AI weather forecast model products onto the "Earth Weather" webpage since 2023. As at October 2025, 15-day surface and upper-air forecast products from five computer models are provided on the webpage. With such a wide range of products available, how should we interpret them?
Forecasts among different models often diverge, no matter they are from traditional NWP or AI models, and the difference increases with longer forecast lead time. For traditional NWP models, differences in initial conditions, resolution and physical parameterization schemes lead to divergent forecasts. On the other hand, while preliminary statistical analysis suggests that AI weather forecast models have achieved performance comparable to or even slightly better than that of traditional NWP models in predicting large-scale weather patterns, there could be significant discrepancies between forecasts from different AI models because of differences in training data and inference schemes. These inter-model differences highlight the inherent uncertainty in weather forecasting.
Taking the forecasts for Super Typhoon Ragasa in late September 2025, which necessitated issuance of the Hurricane Signal, No. 10 by the Observatory, as an example (Figure 1), models demonstrated relatively large discrepancies in its forecast intensity about 9 days before its landfall. ECMWF, ECMWF-AIFS, and Fengwu models suggested that Ragasa would develop into a more intense tropical cyclone, while other models predicted that it would remain relatively weak. Furthermore, models showed divergent forecast track for Ragasa. Some models predicted that it would adopt a track closer to Hong Kong and skirt to our south, while some models predicted Ragasa would move towards the coast of eastern Guangdong. Given these uncertainties in forecasts, users should be careful when interpreting forecasts beyond a few days and avoid relying solely on any single model. Instead, one may wish to take multiple model forecasts into consideration to assess potential weather scenarios in order to have more a comprehensive understanding of the weather trend.
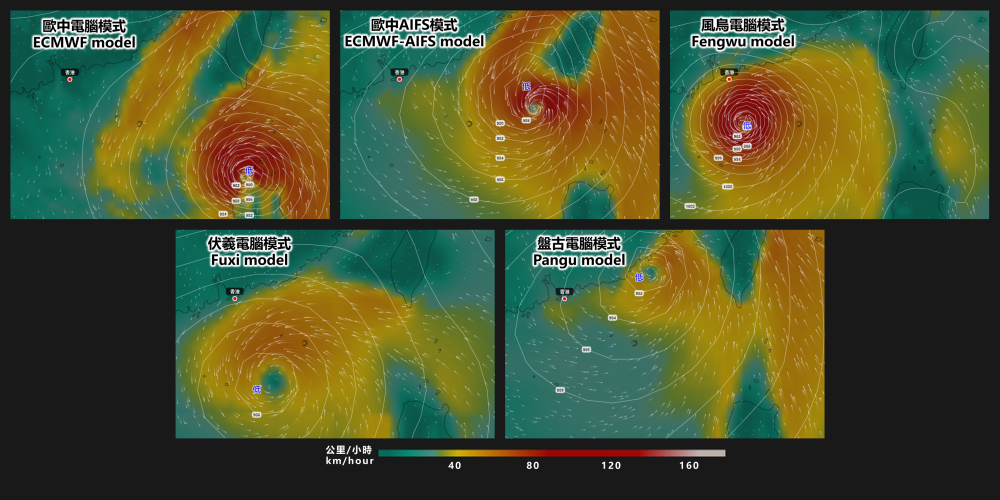
Figure 1 Forecasts from different computer models made on 15th September 2025 for mean sea level pressure, surface wind field and surface wind speed (indicated by isobars, streamlines and colour overlay respectively) at 8 p.m. (Hong Kong time), 23rd September.
Although computer models provide forecasts for various meteorological parameters, such as air temperature, wind, relative humidity, and rainfall, the accuracy of these "direct model output" forecasts is inherently limited by the resolution of the models. Furthermore, the models may not fully account for impacts of topography on various meteorological parameters[1]. Therefore, when interpreting forecasts from computer models, one should not rely solely on direct model outputs but also pay attention to the evolution of both surface and upper-air weather systems.
In fact, weather evolution is affected by atmospheric systems at different altitudes. Taking the heavy rain process in Hong Kong as an example, it is often associated with moisture transport, low-level convergence and mid-level upper-air disturbances[2]. During the series of Black Rainstorm events in early August 2025 (Figure 2), upper-air disturbances edged towards southern China, facilitating ascending motion. This, combined with an active southwest monsoon, supplied abundant moisture to the region. These conditions favoured the triggering and maintaining of the rainstorm process. When using the "Earth Weather" webpage, apart from checking rainfall forecasts of various models, one may also look at the upper-air forecasts to appreciate the evolution of the atmospheric systems mentioned above.
Figure 2 Computer model forecasts for different altitudes in the atmosphere: 700 hPa (upper panel; around 3000 m above the surface) and 925 hPa (middle panel; around 1000 m above the surface) relative humidity, geopotential height, as well as wind direction and speed (indicated by colour overlay, isohypses and streamlines respectively); Surface (lower panel) rainfall, mean sea level pressure, as well as wind direction and speed (indicated by colour overlay, isobars and streamlines).
With technological advancements, the accuracy of computer weather forecast models continues to improve. However, when interpreting the direct output of model forecasts, one should be aware of limitations in models and forecast uncertainties, particularly the potential larger errors for longer forecast lead time. When formulating weather forecasts, Observatory forecasters refer to outputs from multiple models and analyse the real-time weather observations as well as synoptic weather patterns to assess future weather developments.