A rare event on 1-2 April 2024: reduced visibility in Hong Kong under southerly winds
8 May 2024
YW Chan, WH Tang and TK Lau
1. Drop of local visibility
A rare event occurred in Hong Kong on 1-2 April 2024 when local visibility was found dropping unusually (Figure 1) when a southerly airstream was prevailing over the coastal areas of Guangdong. The visibility at Waglan Island fell below 5 km from the evening of 1 April 2024 to the early morning of 2 April 2024. Such gradual fall of local visibility did not show the typical characteristics of mist or fog in the spring season when Hong Kong was affected by a humid maritime airstream. Under the influence of mist or fog, visibility at Waglan Island would tend to drop more sharply. For the gentle decline of local visibility on 1-2 April 2024, other factors might have come into play.
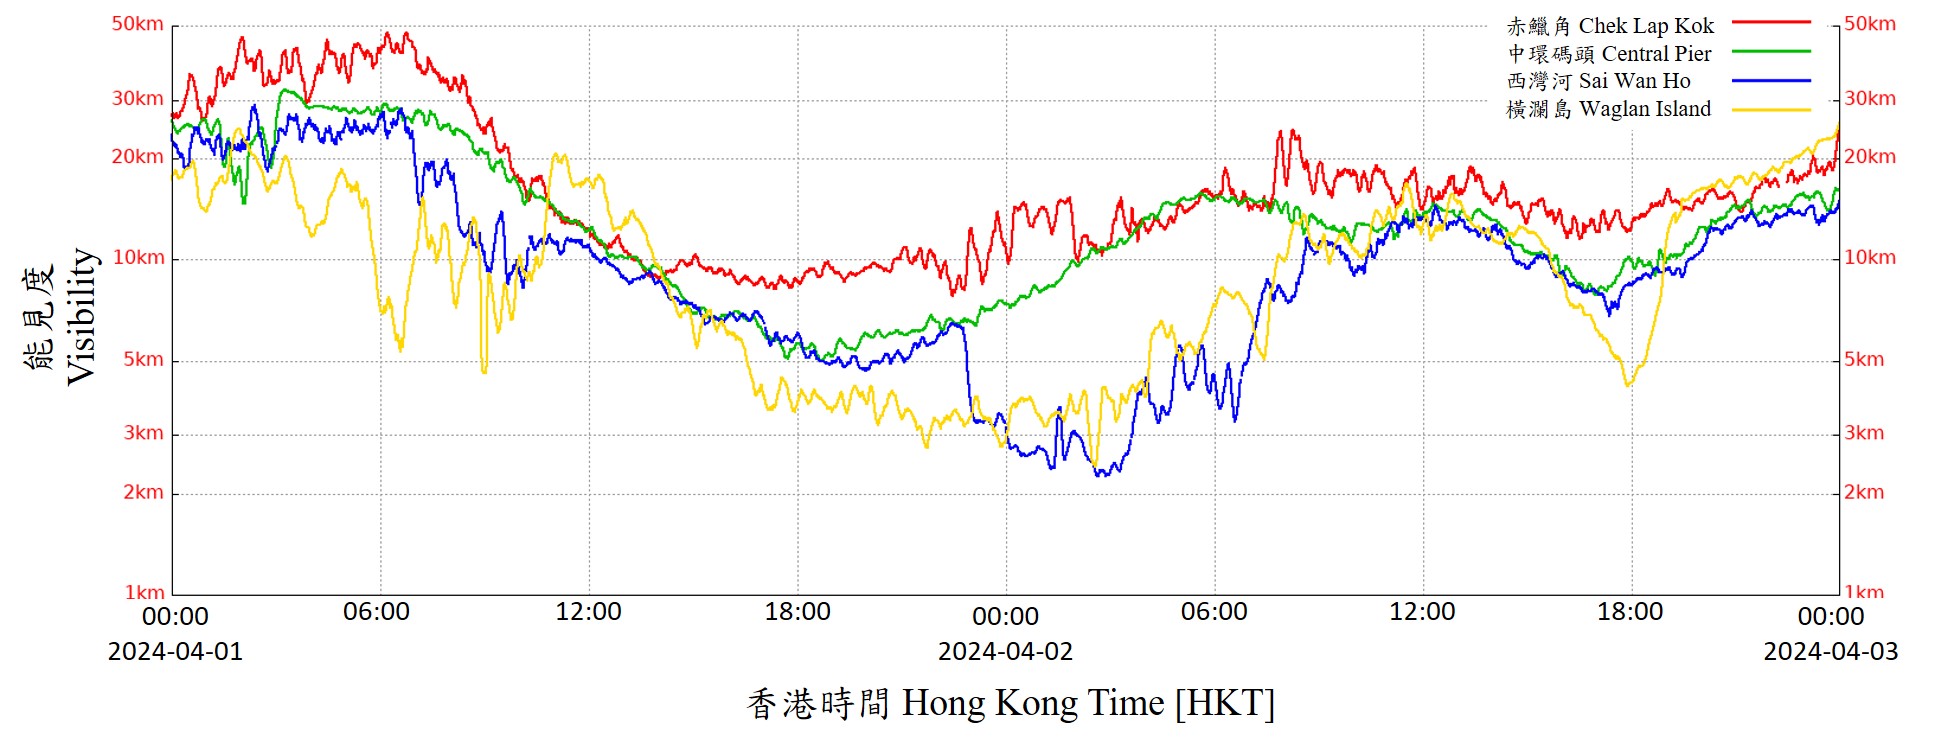
Figure 1. Time-series of visibility at Chek Lap Kok, Central Pier, Sai Wan Ho and Waglan Island on 1 and 2 April 2024.
2. Change of air particulates concentrations
The concentrations of air particulates in Hong Kong on 1-2 April 2024 were analysed. It was observed that the concentrations of respirable suspended particles (PM10), fine suspended particles (PM2.5) and sulfur dioxide (SO2) showed higher levels in the latter part of 1 April 2024 (Figure 2).
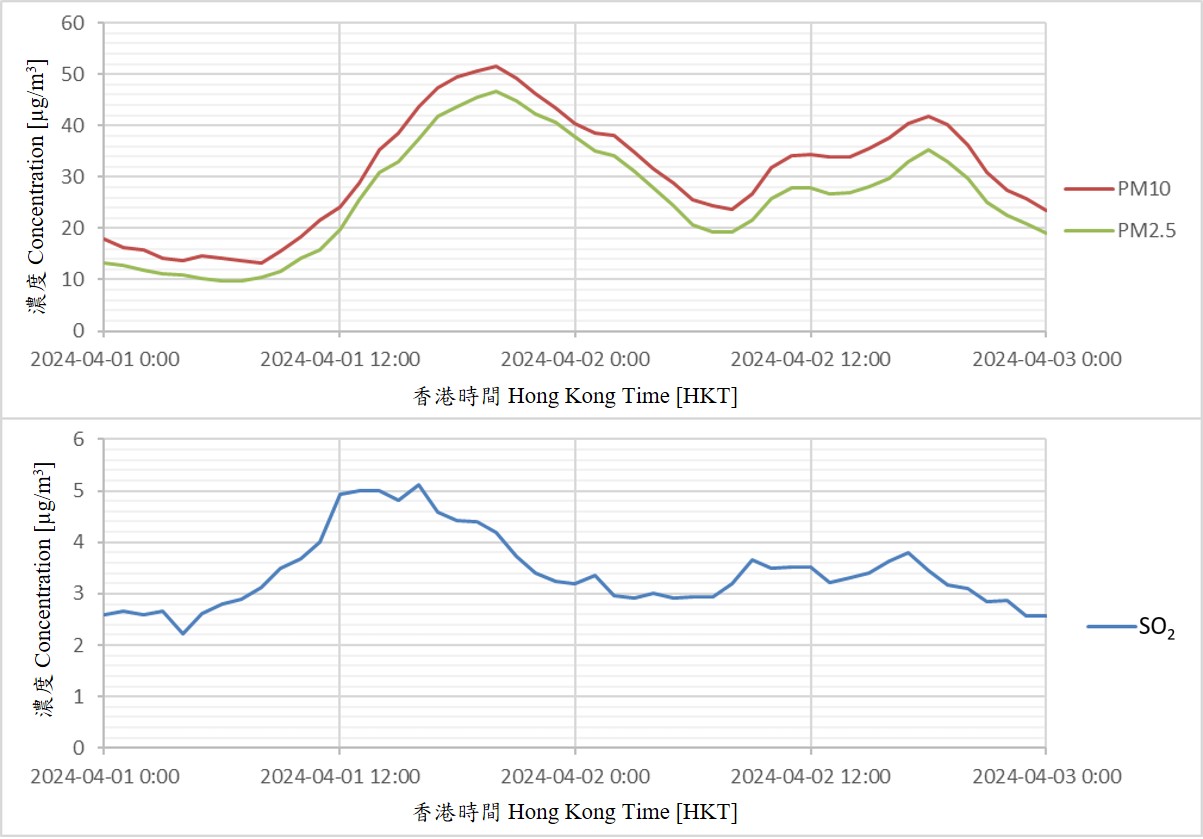
Figure 2. Time series of concentrations of air particulates (PM10 and PM2.5) and sulfur dioxide (SO2) (based on averaged concentrations from all general stations in Hong Kong) on 1-2 April 2024 (Source: Environmental Protection Department).
3. Surface weather observations
If the particulates were not all produced locally, it was likely that they were transported to Hong Kong following the atmospheric wind flow. With reference to the surface pressure chart at 20:00 Hong Kong Time (HKT) on 1 April 2024, a southerly airstream affected the coast of Guangdong that day (Panel a in Figure 3) and there was quite widespread haze affecting Indo-China and the northern part of Luzon (Panel b in Figure 3). According to the upper-air winds at 925 hPa (around 0.8 km above ground level) and 850 hPa (around 1.5 km above ground level), winds over Hong Kong at these two levels were basically south to southwesterlies (Panels c and d in Figure 3 respectively).
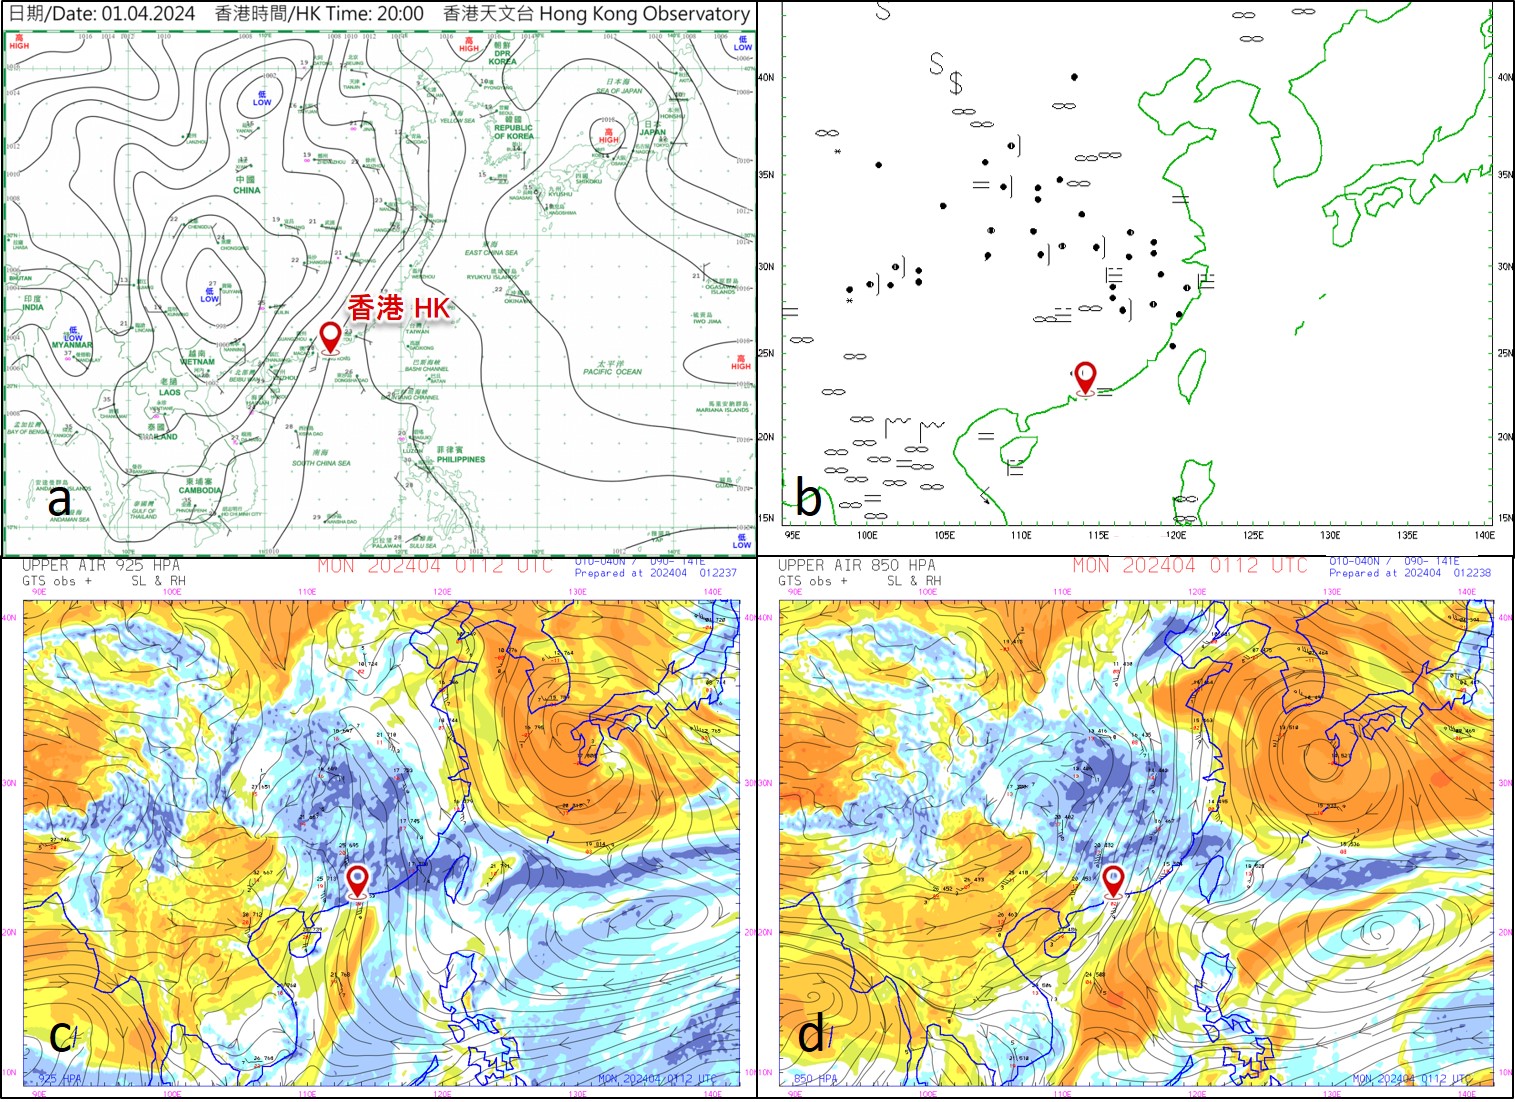
Figure 3. The surface pressure (Panel a) and weather observations (Panel b) charts as well as upper-air winds at 925 hPa (Panel c) and 850 hPa (Panel d) at 20:00 HKT on 1 April 2024. " " and "
 " in Panel b represent reduced visibility caused by haze and smoke respectively.
4. Satellite observations
Using remote sensing technology, images from the geostationary satellites Fengyun-4B (FY-4B) and Geostationary Korea Multi-Purpose Satellite-2B (GK-2B) were referenced. FY-4B true colour image at 16:00 HKT on 1 April 2024 suggested the presence of abundant aerosols over Indo-China, Beibu Wan and the northern part of the South China Sea (SCS) (red ellipses in Figure 4a). Concurrently, FY-4B hot spot detection product (red dots in insets of Figure 4b and 4c) indicated widespread wildfires occurring over Indo-China which suggested extensive biomass burning activities taking place over the region. Images from GK-2B around 14:45 HKT showed high Aerosol Optical Depth (AOD) values over Beibu Wan and the northwestern part of the SCS (Figure 5). It was suspected that aerosols over the northern part of the SCS followed the southerly winds and drifted towards the coastal areas of Guangdong which lowered the visibility in Hong Kong in the latter part of 1 April 2024.
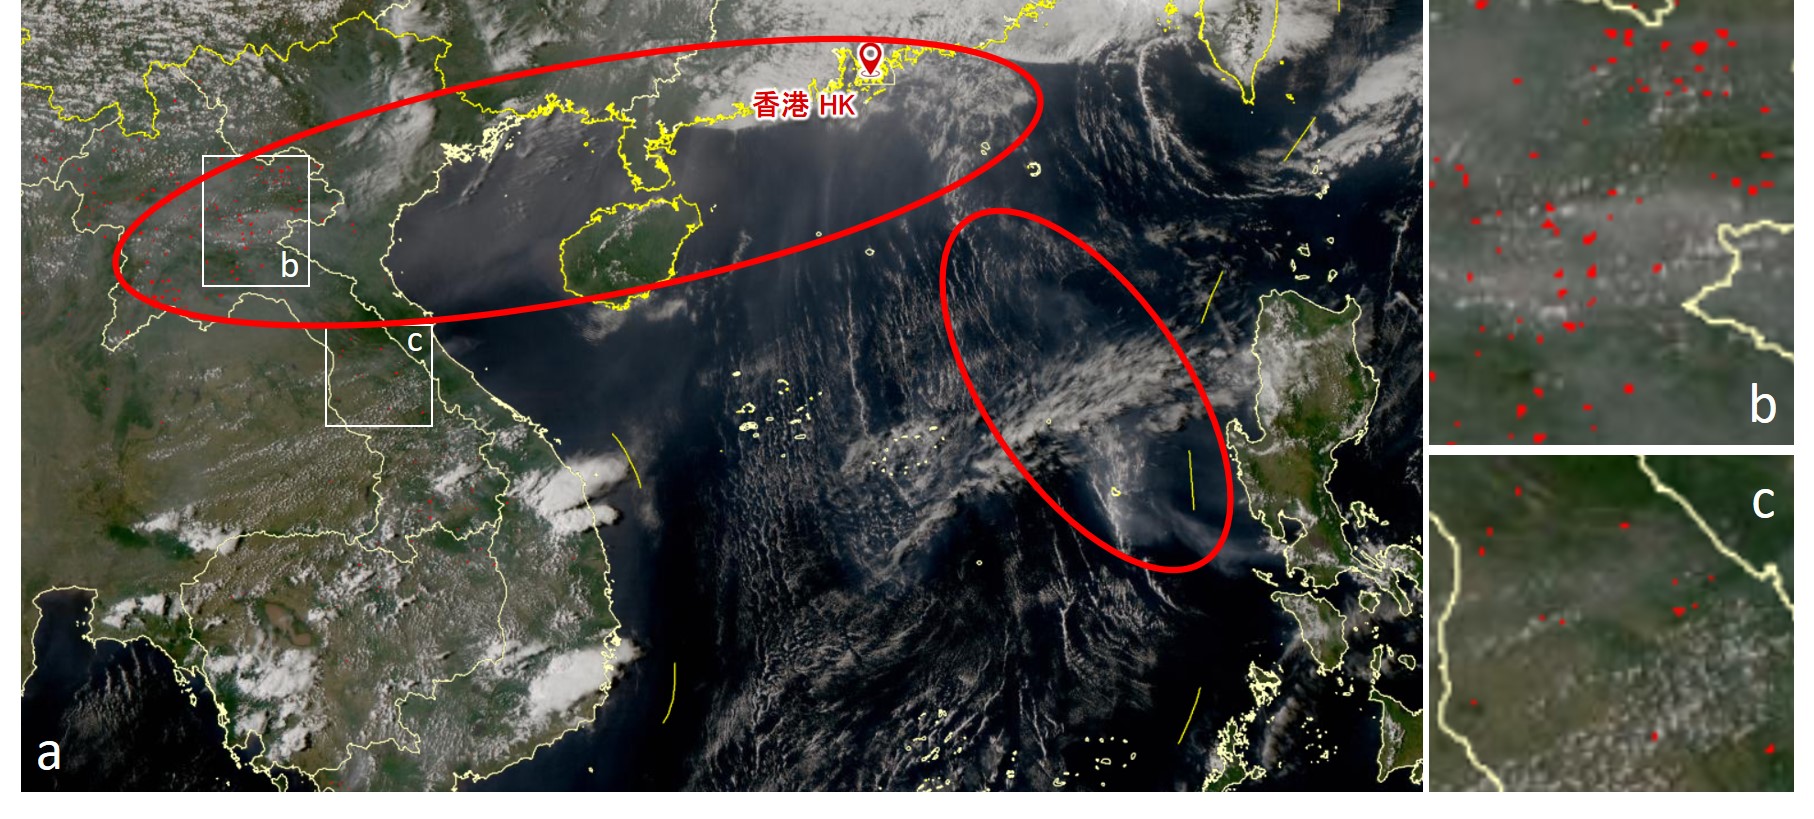
Figure 4. FY-4B satellite true colour image at 16:00 HKT on 1 April 2024 (red dots indicated hot spots detected by FY-4B that day and suggested the occurrence of wildfires at many locations over Indo-China) (Source: National Satellite Meteorological Center, China Meteorological Administration).
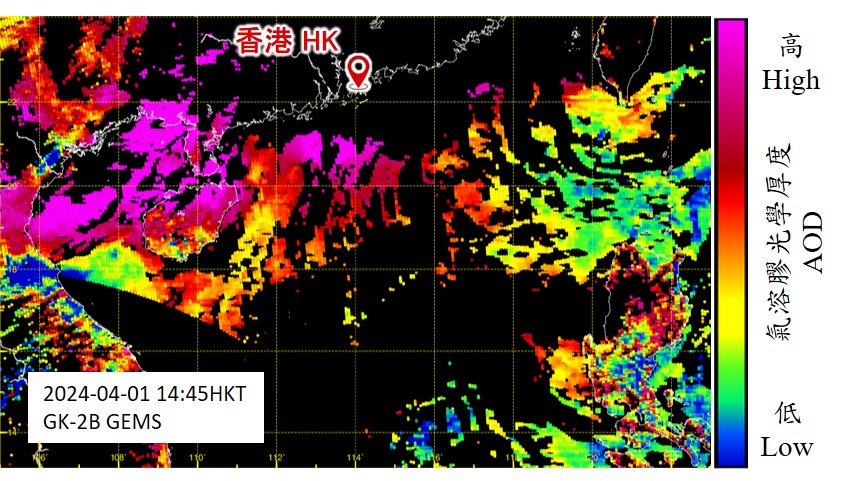
Figure 5. AOD measured by the Geostationary Environmental Monitoring Spectrometer (GEMS) onboard of GK-2B satellite at around 14:45 HKT on 1 April 2024 (Source: National Institute of Environmental Research of Korea).
5. Radar observations
Interestingly, radar images managed to capture some echoes over the northwestern part of the SCS in the early morning of 2 April 2024 when local visibility stayed on the low side. The reflectivity and Doppler velocity image based on 0.1° Plan Position Indicator (PPI) scan from the Tate’s Cairn Weather Radar (TCWR) around 02:00 HKT on 2 April 2024 (Panels a and b in Figure 6 respectively) showed echoes beyond 200 km and at a height of 3 km or above to the southwest of Hong Kong, which edged slowly towards the coastal areas.
From the TCWR spectrum width image (Panel c in Figure 6), the echoes were apparently not embedded in a highly turbulent environment with the low spectrum width values. More importantly from the TCWR correlation coefficient (CC) image, the low CC values (< 0.8) associated with the echoes suggested that they were probably non-meteorological in nature.
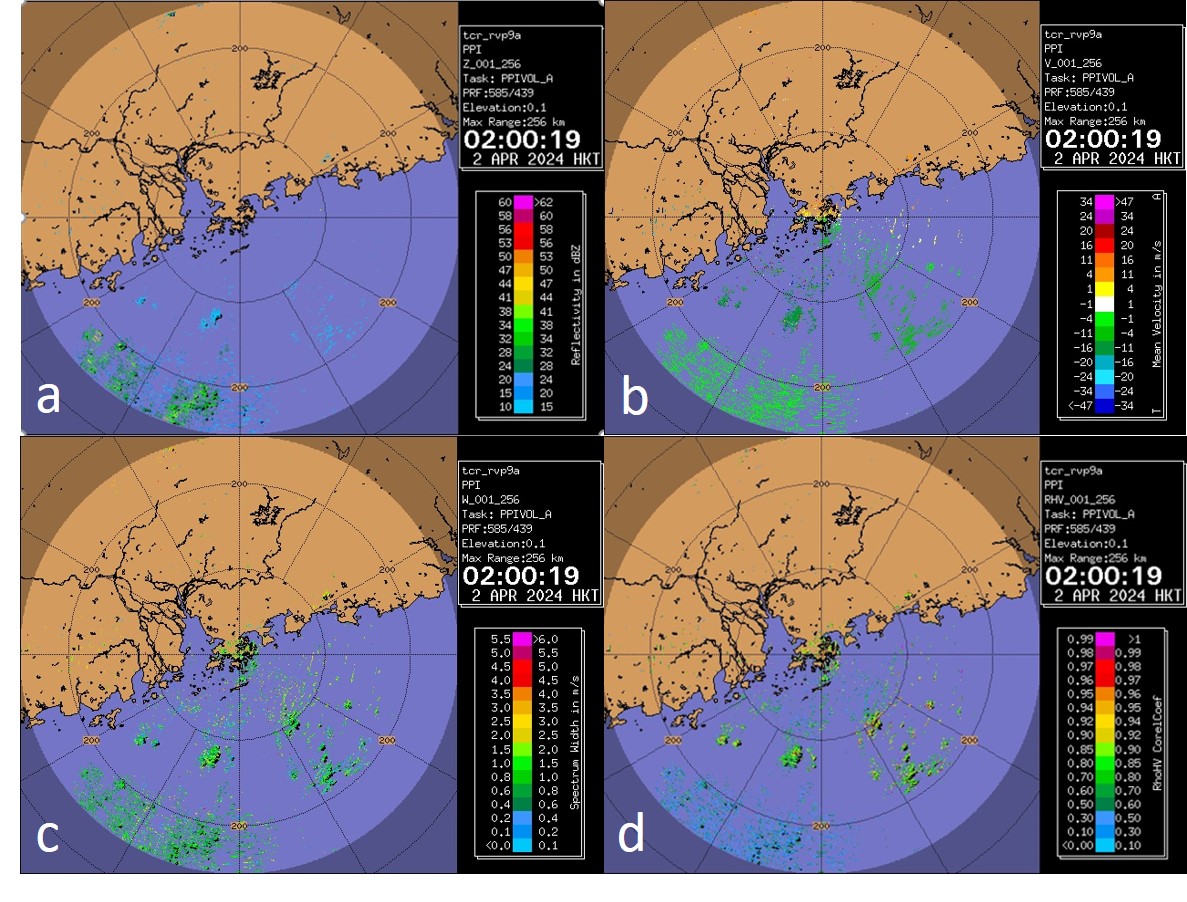
Figure 6. The reflectivity and Doppler velocity images captured by the TCWR (Panels a and b respectively) at around 02:00 HKT on 2 April 2024. The TCWR’s spectrum width and correlation coefficient around that time are shown in Panels c and d respectively.
6. Trajectory analysis
As reduced visibility and rise of aerosols concentrations have already affected Hong Kong on 2 April 2024, a 3-day backward trajectory dating back from 08:00 HKT on 2 April 2024 was conducted in order to identify the potential sources of the aerosols. The result showed that it was originated from the seas to the west of Luzon (Figure 7). Coincidentally, there was an active release of SO2 from Volcano Taal about 65 km south of Manila in the Philippines in late March 2024 according to the advisory reports from the Philippine Institute of Volcanology and Seismology (PHIVOLCS), though the release of volcanic ashes or dusts was not apparent based on observations from satellite images. SO2 plume was observed to spread northwards towards the south China coastal areas on 1 April 2024 as confirmed by GK-2B column SO2 observations (Figure 8). With SO2 serving as a tracer, it was possible that fine dusts and aerosols released from Volcano Taal could drift northwards to affect the coastal areas of Guangdong on 1-2 April 2024.
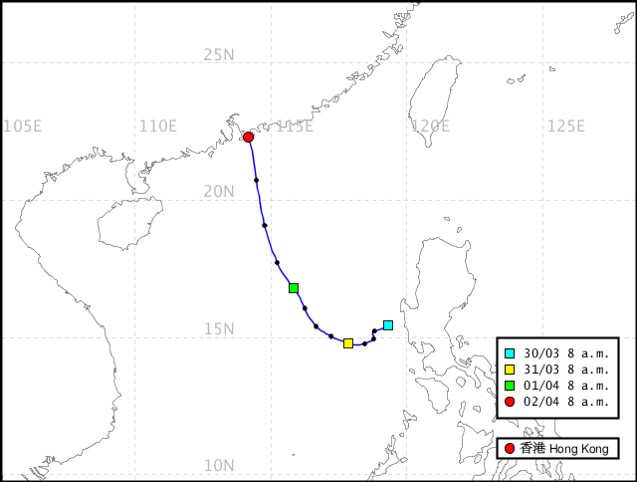
Figure 7. 3-day backward trajectory analysis dating back from 08:00 HKT on 2 April 2024.
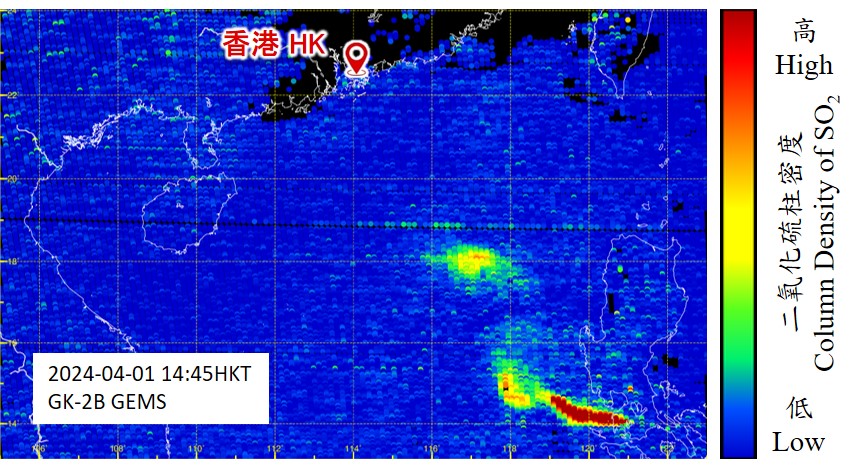
Figure 8. Column density of SO2 measured by GK-2B satellite at around 14:45 HKT on 1 April 2024 (Source: National Institute of Environmental Research of Korea).
Taking reference of the locations of hot spots over Indo-China as detected by the FY-4B satellite, forward trajectory analysis was conducted to evaluate the spreading of biomass burning aerosols particularly when low-level winds changed to generally southwesterlies towards the south China coast on 31 March 2024. The results of a 4-day forward trajectory starting at 08:00 HKT on 31 March 2024 with release height of 300 m are shown in Figure 9. Some trajectory paths indicate spreading towards the northwestern part of the SCS and seas to the southeast of the Hainan Island, consistent with the satellites and radar observations. However, it was a bit late in terms of timing considering that increase of aerosols was already observed in Hong Kong in the latter part of 1 April 2024.
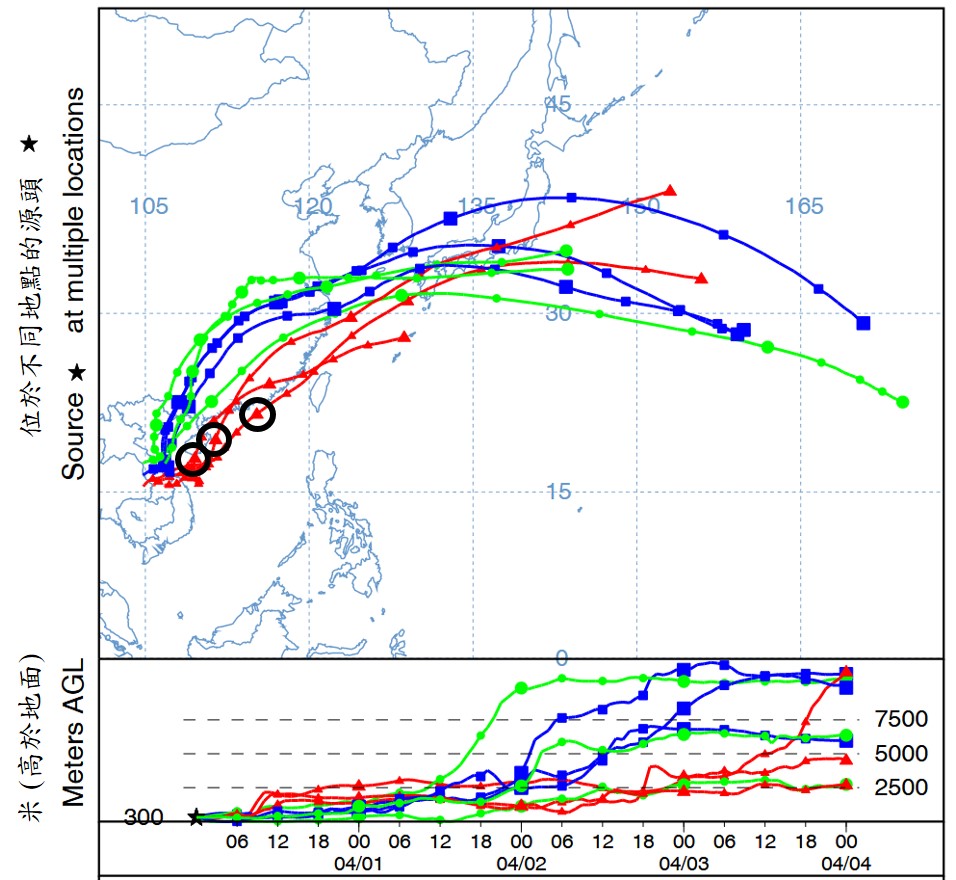
Figure 9. 4-day forward trajectory analysis starting from 08:00 HKT on 31 March 2024. For those trajectories in red colour that came close to Hainan Island and affected the northwestern part of the SCS, the positions at 08:00 HKT on 2 April 2024 (or 48 hours after release) are shown in the black circles.
7. Model simulation of SO2 dispersion
A dispersion model named “FLEXPART” was used based on a hypothetical SO2 concentration source to evaluate if the SO2 plume could reach the south China coastal areas after releasing from the Volcano Taal. Taking the release time as 08:00 HKT on 30 March 2024 when low-level prevailing winds over the northern part of the SCS were generally southerlies and a release height of 1 km based on advisory reports from PHIVOLCS, the simulation results showed that the SO2 plume could reach the eastern coast of Guangdong on 2 April 2024 (Figure 10). Any fine dusts or aerosols contained in the SO2 plume could possibly affect Hong Kong and the coastal region of eastern Guangdong.
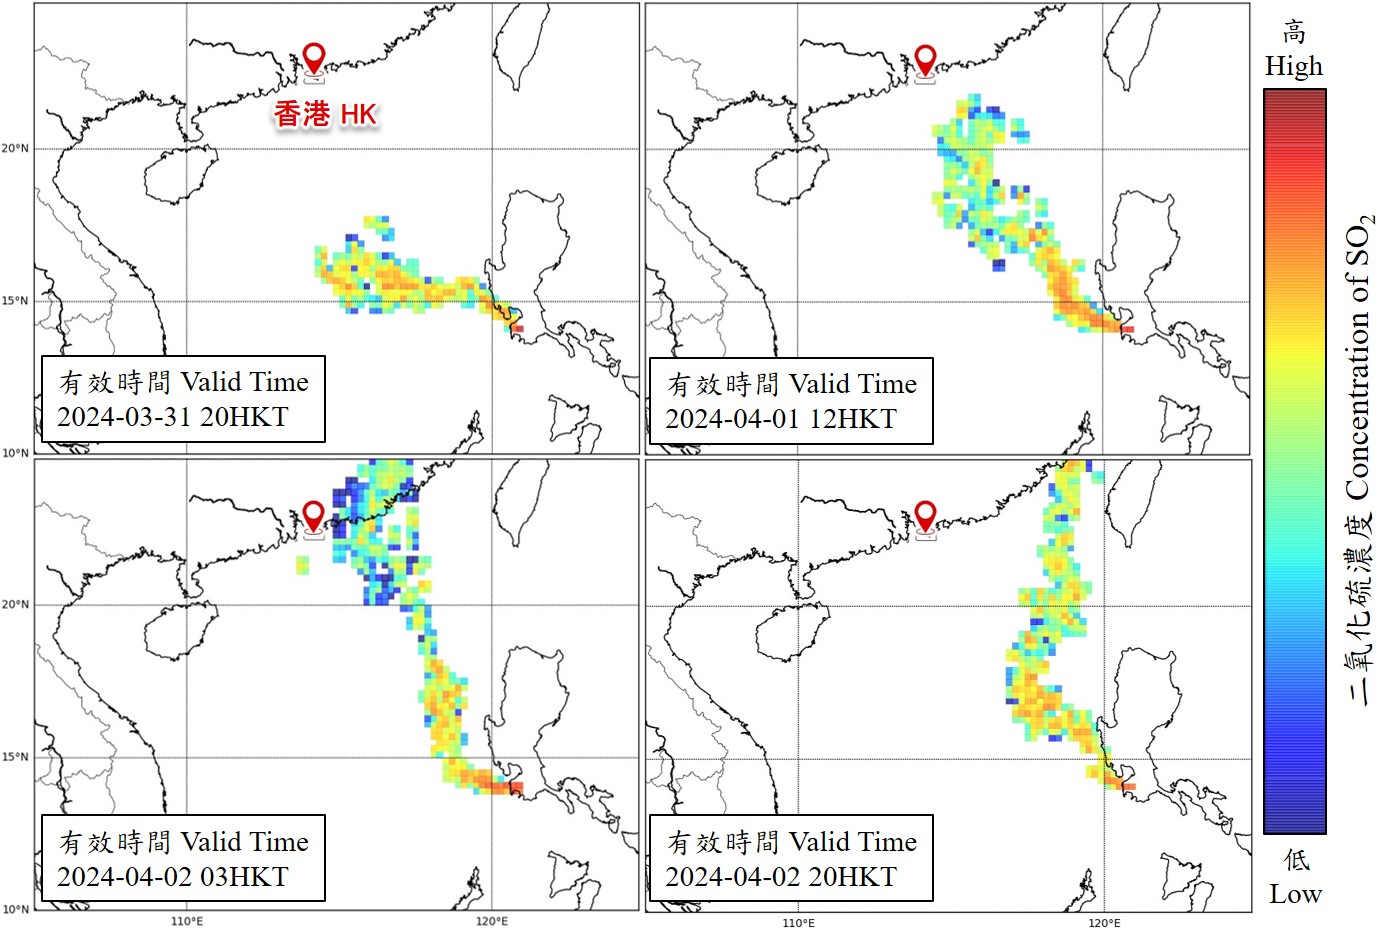
Figure 10. Simulation of dispersion of SO2 plume emitted from the Volcano Taal in the Philippines. Following low-level southerly winds, the SO2 plume could drift northwards and affect the eastern part of Guangdong on 2 April 2024.
8. Upper-air analysis
Presumably, the drop of local visibility and rise of PM10 and PM2.5 in Hong Kong implied the arrival of aerosols from the south in the latter part of 1 April 2024. The upper-air profiles were analysed to evaluate if there was any significant change of low-level air and dew point temperatures. The results (Panels a to d in Figure 11) showed an apparent drop of dew point temperatures at around 1.5 km height at both 20:00 HKT on 1 April 2024 (Panel c) and 08:00 HKT on 2 April 2024 (Panel d). Under south to southwesterlies, it should be generally moist in the lower atmosphere which was the case at 20:00 HKT on 31 March 2024 and 08:00 HKT on 1 April 2024 (Panel b). The sharp drop of dew point temperatures was unusual which might be linked to the impact of aerosols. Taking into account the forward trajectory results as discussed in section 6 above, biomass burning aerosols could drift towards the south China coastal areas at elevated height (Figure 9). Whether this could fully account for the drop of dew point temperatures in the upper-air profiles required further study.
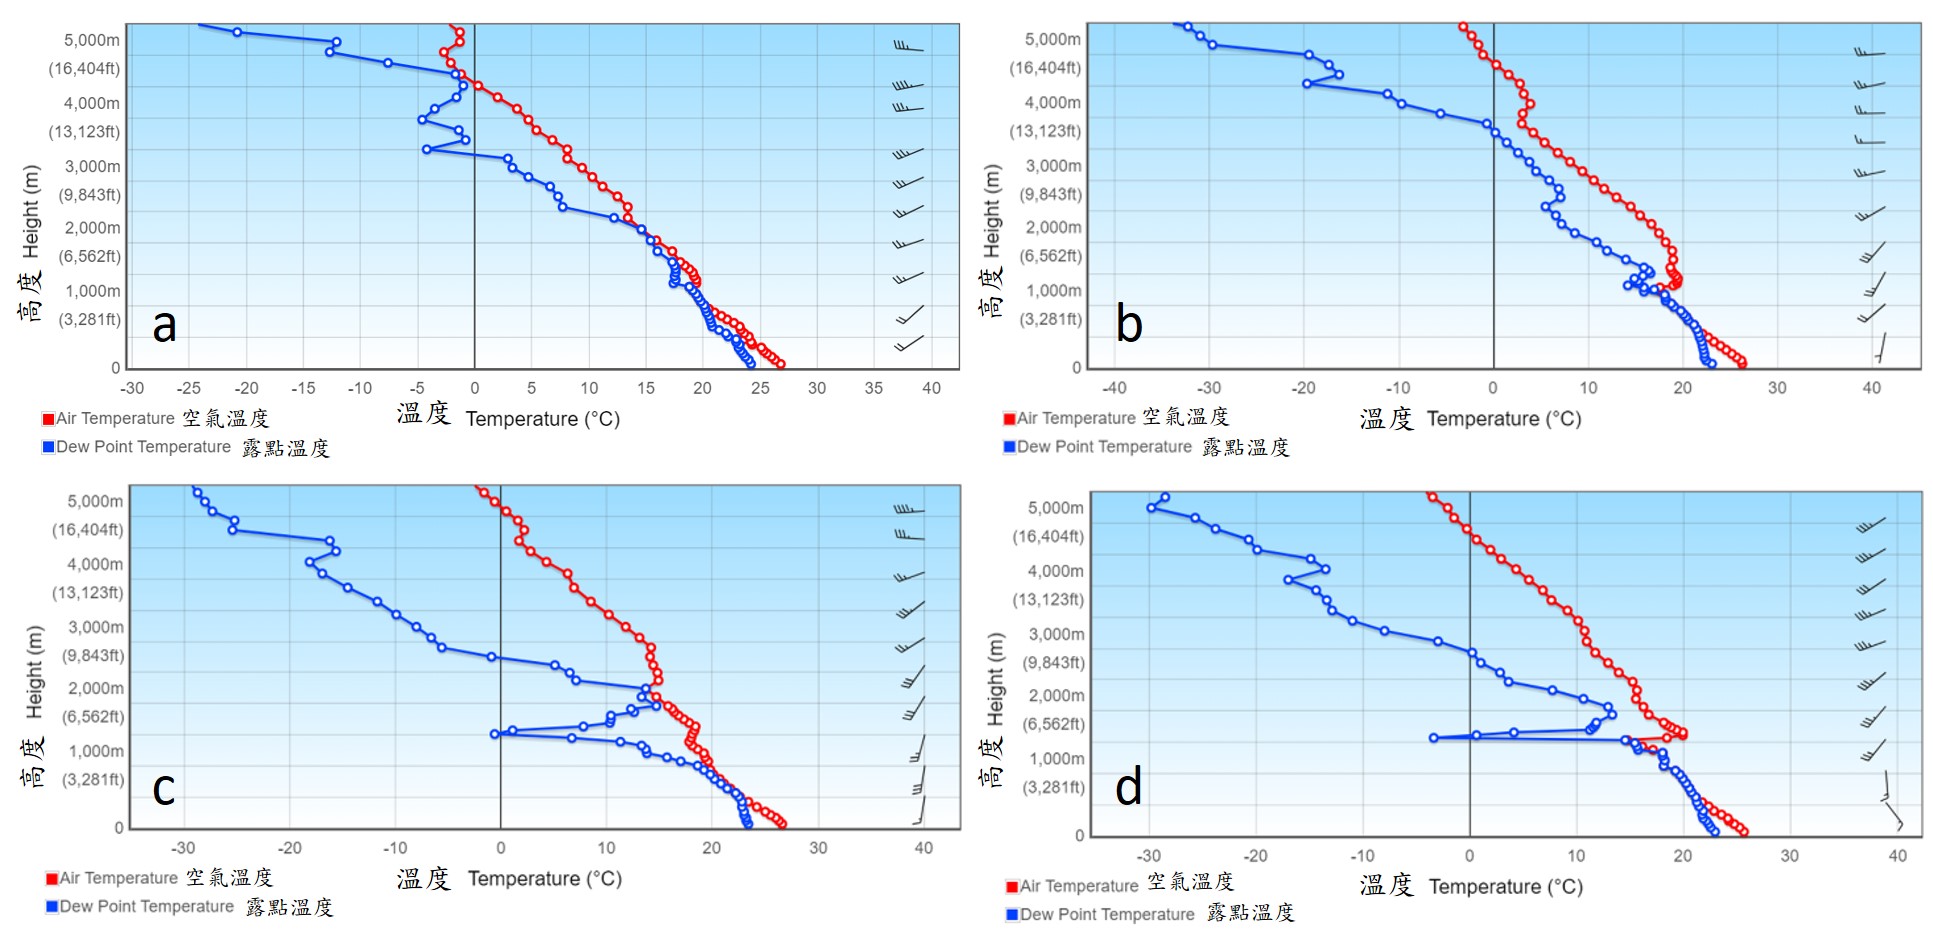
Figure 11. Vertical variation of air and dew point temperatures below 5 km height based on radiosondes measurement results at 20:00 HKT on 31 March 2024 (Panel a), 08:00 HKT on 1 April 2024 (Panel b), 20:00 HKT on 1 April 2024 (Panel c) and 08:00 HKT on 2 April 2024 (Panel d).
9. Summary of preliminary findings
The rare event of visibility drop in Hong Kong on 1-2 April 2024 under southerly winds did not resemble the impact of mist or fog and was likely caused by other factors. While widespread haze was reported over Indo-China and northern Luzon in the above period, FY-4B true colour satellite images at 16:00 HKT on 1 April 2024 seemed to show extensive aerosols covering the northern part of the SCS. AOD measurements from GK-2B satellite at around 14:45 HKT on 1 April 2024 indicated high AOD values over Beibu Wan and the northwestern part of the SCS, consistent with FY-4B observations. Radar reflectivity images from TCWR around 02:00 HKT on 2 April 2024 showed echoes beyond 200 km southwest of Hong Kong at around 3 km height or above. The echoes were edging slowly towards the coastal areas. With low CC values, the echoes might be scattering particles with non-meteorological characteristics. The TCWR’s observations suggested the presence of scatters (may be aerosols or fine dusts) aloft over the northwestern part of the SCS.
Backward trajectory analysis suggested that the sources of aerosols affecting Hong Kong on 1-2 April 2024 could also be originated from the seas to the west of Luzon. The aerosols might come from the emissions of Volcano Taal as suggested by the northward spreading of SO2 plume observed by GK-2B satellite. Forward trajectory analysis indicated possibility of biomass burning aerosols from Indo-China spreading towards the south China coastal areas, though the timing did not quite match with the time of increasing aerosols concentrations in Hong Kong in the latter part of 1 April 2024. If biomass burning aerosols did drift to Hong Kong at elevated height, it might account for the sharp drop of dew point temperatures at around 1.5 km height as reflected from the upper-air profiles at 20:00 HKT on 1 April 2024 and 08:00 HKT on 2 April 2024.
The FLEXPART dispersion model did support the inference that SO2 plume could reach the coast of eastern Guangdong on 2 April 2024. This might also explain why the drop of visibility in Hong Kong was more severe at Sai Wan Ho and Waglan Island (Figure 1) on 1-2 April 2024 than that at Chek Lap Kok.