Half-monthly normals of Air Temperature and Rainfall recorded at the Hong Kong Observatory, 1981-2010
| Date | Air Temperature Figure |
Mean Total Rainfall (mm) Figure |
||
|---|---|---|---|---|
| Mean Maximum (deg.C) |
Mean (deg.C) |
Mean Minimum (deg.C) |
||
| Jan 01-15 | 19.0 | 16.7 | 14.9 | 10.6 |
| Jan 16-31 | 18.2 | 15.9 | 14.1 | 14.4 |
| Feb 01-15 | 18.7 | 16.5 | 14.8 | 27.8 |
| Feb 16-29 | 19.1 | 17.0 | 15.2 | 27.4 |
| Mar 01-15 | 20.5 | 18.1 | 16.2 | 24.6 |
| Mar 16-31 | 22.3 | 20.0 | 18.2 | 57.6 |
| Apr 01-15 | 23.7 | 21.4 | 19.7 | 90.1 |
| Apr 16-30 | 26.3 | 23.7 | 21.9 | 84.5 |
| May 01-15 | 28.1 | 25.4 | 23.6 | 132.9 |
| May 16-31 | 28.7 | 26.4 | 24.6 | 172.0 |
| Jun 01-15 | 29.7 | 27.4 | 25.7 | 228.9 |
| Jun 16-30 | 30.7 | 28.5 | 26.6 | 227.3 |
| Jul 01-15 | 31.4 | 28.8 | 26.8 | 165.1 |
| Jul 16-31 | 31.3 | 28.8 | 26.7 | 211.5 |
| Aug 01-15 | 31.2 | 28.7 | 26.6 | 205.9 |
| Aug 16-31 | 31.1 | 28.5 | 26.6 | 226.3 |
| Sep 01-15 | 30.6 | 28.1 | 26.2 | 190.4 |
| Sep 16-30 | 29.6 | 27.3 | 25.5 | 137.5 |
| Oct 01-15 | 28.6 | 26.4 | 24.6 | 67.4 |
| Oct 16-31 | 26.9 | 24.7 | 22.9 | 33.4 |
| Nov 01-15 | 25.1 | 22.8 | 20.9 | 21.1 |
| Nov 16-30 | 23.0 | 20.7 | 18.7 | 16.8 |
| Dec 01-15 | 21.0 | 18.8 | 16.8 | 11.7 |
| Dec 16-31 | 19.5 | 17.2 | 15.1 | 15.0 |
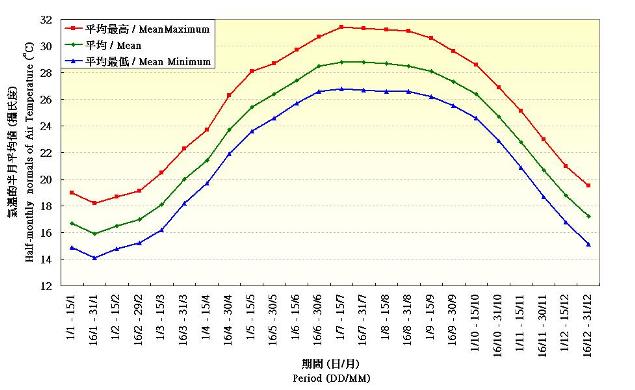
Figure 1. Half-monthly normals of Air Temperature recorded at the Hong Kong Observatory(1981-2010)
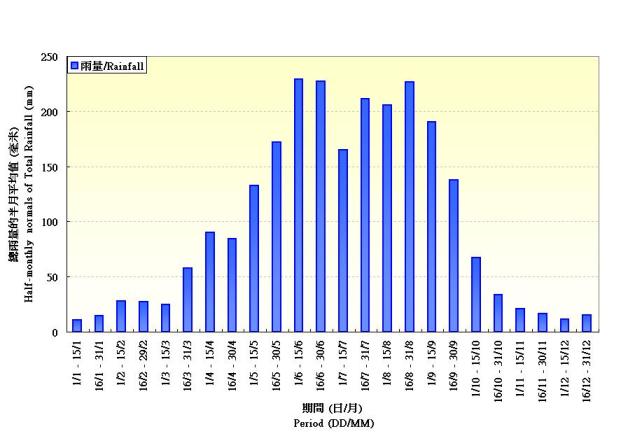
Figure 2. Half-monthly normals of Rainfall recorded at the Hong Kong Observatory (1981-2010)