The Weather of September 2020
Mainly attributing to the higher than normal sea surface temperature over the northern part of the South China Sea, September 2020 was hotter than usual in Hong Kong. The monthly mean temperature of 28.4 degrees was 0.7 degree above the normal figure of 27.7 degrees. With more than usual low-level moisture supply from the south over southern China, the month was also much cloudier and wetter than usual. The monthly total rainfall was 708.8 millimetres, about 116 percent above the normal figure of 327.6 millimetres and the sixth highest on record for September. The mean amount of cloud in the month was 78 percent, 12 percent above the normal of 66 percent and one of the third highest on record for September. The duration of bright sunshine in the month was only 131.3 hours, about 24 percent lower than the normal figure of 172.3 hours and the fifth lowest on record for September. The accumulated rainfall up to September this year was 2246.0 millimetres, slightly more than the normal figure of 2233.1 millimetres for the same period.
Under the influence of a weak continental airstream, the weather of Hong Kong was generally fine and very hot on the first three days of the month. With plenty of sunshine, the maximum temperature at the Observatory soared to 34.2 degrees on 2 September, the highest of the month. However, high temperatures also triggered thundery showers in the afternoon over parts of the territory during these few days. Showery activity continued to affect the territory on 4 – 5 September. The heavy showers and thunderstorms on the morning of 5 September necessitated the issuance of the Red Rainstorm Warning. More than 40 millimetres of rainfall were recorded over Hong Kong Island, Kowloon and Tseung Kwan O and the rainfall even exceeded 100 millimetres over Southern District, Eastern District and Kwun Tong. In the midst of the downpour, the temperature at the Observatory dropped to a minimum of 25.2 degrees, the lowest of the month.
Under light wind condition, apart from a few showers and thunderstorms, it was hot with sunny intervals on 6 September. With a trough of low pressure lingering over the south China coast, the weather in Hong Kong became unsettled with occasional showers and thunderstorms on 7 – 12 September. The showers were particularly heavy on 8 and 12 September with more than 100 millimetres of rainfall recorded over Wong Tai Sin, Sha Tin and Sai Kung on 8 September and over 50 millimetres of rainfall over many parts of the territory on 12 September.
Under the influence of an easterly airstream, local weather was mainly cloudy with sunny periods and a few showers on 13 September. With the setting in of an upper-air disturbance, the weather became unsettled again with occasional heavy showers and thunderstorms on 14 - 15 September. More than 50 millimetres of rainfall were recorded over most parts of the territory and the rainfall even exceeded 150 millimetres over Sai Kung on 15 September.
Meanwhile, an area of low pressure gradually developed into a tropical depression over the southern part of the South China Sea on the night of 15 September and later named as Noul. It moved generally west-northwestward across the South China Sea and intensified into a severe tropical storm on the morning of 17 September. Noul made landfall over central part of Vietnam the next morning and weakened gradually into an area of low pressure over Indochina Peninsula on 19 September.
Locally, affected by the anticyclone aloft, it was hot with sunny periods and less showers on 16 September. Under the combined effect of Noul and the northeast monsoon, the weather of Hong Kong became mainly cloudy and windy with occasional showers and squally thunderstorms on 17 - 18 September. A broad trough of low pressure continued to bring showery weather and squally thunderstorms to Hong Kong the next day. With the strengthening of anticyclone aloft, the weather became hot with sunny periods and fewer showers on 20 September.
A fresh easterly airstream set in on 21 September and brought heavy showers and thunderstorms to the territory in the afternoon and at night. More than 50 millimetres of rainfall were recorded over many places and the rainfall even exceeded 100 millimetres over most parts of the urban areas, necessitating the issuance of the Red Rainstorm Warning. Affected by a drier easterly airstream and the subsequent weak northeast monsoon, local weather improved with sunny periods and less showers on 22 – 24 September. With the setting in of a fresh to strong easterly airstream, local weather turned mainly cloudy with a few showers later on 25 September and remained so in the next two days. A tornado was reported near the Hong Kong International Airport on the afternoon of 25 September. Affected by a broad trough of low pressure over the northern part of the South China Sea, there were heavy showers on the evening of 28 September. More than 10 millimetres of rainfall were recorded over many places and the rainfall even exceeded 70 millimetres over Southern District of the Hong Kong Island. The broad trough of low pressure continued to bring showers and thunderstorms to Hong Kong on 29 September. A band of intense thundery showers moved across the coastal areas of Guangdong and brought heavy rain and squally thunderstorms to Hong Kong on the evening of 30 September. More than 70 millimetres of rainfall were recorded in most parts of the territory and rainfall even exceeded 100 millimetres over Hong Kong Island and Kowloon, necessitated the issuance of Black Rainstorm Warning.
Five tropical cyclones occurred over the South China Sea and the western North Pacific in September 2020.
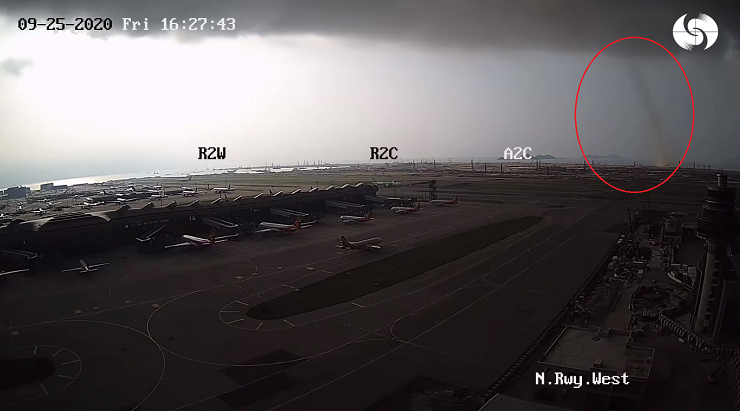
A tornado was reported near the Hong Kong International Airport on the afternoon of 25 September 2020
Details of issuance and cancellation of various warnings/signals in the month are summarized in Tables 1.1 to 1.5. Monthly meteorological figures and departures from normal for September are tabulated in Table 2.
Warnings and Signals issued in September 2020
| Beginning Time | Ending Time | ||
|---|---|---|---|
| Day/Month | HKT | Day/Month | HKT |
| 18 / 9 | 1440 | 19 / 9 | 0845 |
| Colour | Beginning Time | Ending Time | ||
|---|---|---|---|---|
| Day/Month | HKT | Day/Month | HKT | |
| Amber | 5 / 9 | 0855 | 5 / 9 | 0955 |
| Red | 5 / 9 | 0955 | 5 / 9 | 1055 |
| Amber | 5 / 9 | 1055 | 5 / 9 | 1115 |
| Amber | 8 / 9 | 0425 | 8 / 9 | 1000 |
| Amber | 12 / 9 | 1410 | 12 / 9 | 1600 |
| Amber | 12 / 9 | 2130 | 12 / 9 | 2230 |
| Amber | 15 / 9 | 1210 | 15 / 9 | 1715 |
| Amber | 21 / 9 | 1430 | 21 / 9 | 1800 |
| Red | 21 / 9 | 1800 | 21 / 9 | 2010 |
| Amber | 21 / 9 | 2010 | 21 / 9 | 2140 |
| Amber | 28 / 9 | 1810 | 28 / 9 | 1940 |
| Amber | 30 / 9 | 1915 | 30 / 9 | 1950 |
| Red | 30 / 9 | 1950 | 30 / 9 | 2010 |
| Black | 30 / 9 | 2010 | 30 / 9 | 2125 |
| Red | 30 / 9 | 2125 | 30 / 9 | 2245 |
| Amber | 30 / 9 | 2245 | 30 / 9 | 2330 |
| Beginning Time | Ending Time | ||
|---|---|---|---|
| Day/Month | HKT | Day/Month | HKT |
| 31 / 8 | 2115 | 1 / 9 | 0200 |
| 1 / 9 | 1455 | 1 / 9 | 2100 |
| 2 / 9 | 1305 | 2 / 9 | 1745 |
| 3 / 9 | 1240 | 3 / 9 | 1645 |
| 4 / 9 | 1120 | 4 / 9 | 1400 |
| 4 / 9 | 2350 | 5 / 9 | 0120 |
| 5 / 9 | 0652 | 5 / 9 | 1300 |
| 6 / 9 | 0525 | 6 / 9 | 1200 |
| 6 / 9 | 1325 | 6 / 9 | 1715 |
| 7 / 9 | 0605 | 7 / 9 | 1000 |
| 7 / 9 | 1855 | 7 / 9 | 2100 |
| 7 / 9 | 2305 | 8 / 9 | 1130 |
| 8 / 9 | 1255 | 8 / 9 | 1400 |
| 9 / 9 | 0345 | 9 / 9 | 1130 |
| 9 / 9 | 1150 | 9 / 9 | 1500 |
| 10 / 9 | 0540 | 10 / 9 | 1100 |
| 10 / 9 | 1537 | 10 / 9 | 1915 |
| 11 / 9 | 0710 | 11 / 9 | 1330 |
| 12 / 9 | 0445 | 12 / 9 | 0830 |
| 12 / 9 | 1250 | 12 / 9 | 2400 |
| 13 / 9 | 1400 | 13 / 9 | 1440 |
| 13 / 9 | 2230 | 14 / 9 | 0600 |
| 14 / 9 | 1000 | 14 / 9 | 1545 |
| 15 / 9 | 0300 | 16 / 9 | 0045 |
| 17 / 9 | 0555 | 17 / 9 | 1600 |
| 17 / 9 | 1730 | 17 / 9 | 2030 |
| 17 / 9 | 2120 | 18 / 9 | 0500 |
| 18 / 9 | 1105 | 18 / 9 | 1230 |
| 18 / 9 | 1300 | 18 / 9 | 2230 |
| 19 / 9 | 0110 | 19 / 9 | 0230 |
| 19 / 9 | 0245 | 19 / 9 | 0900 |
| 19 / 9 | 1145 | 19 / 9 | 2230 |
| 20 / 9 | 0855 | 20 / 9 | 1100 |
| 21 / 9 | 0600 | 21 / 9 | 0700 |
| 21 / 9 | 0800 | 22 / 9 | 0520 |
| 23 / 9 | 2025 | 23 / 9 | 2230 |
| 24 / 9 | 0140 | 24 / 9 | 0730 |
| 28 / 9 | 1650 | 28 / 9 | 1945 |
| 29 / 9 | 1115 | 29 / 9 | 1530 |
| 30 / 9 | 0000 | 30 / 9 | 0200 |
| 30 / 9 | 1300 | 1 / 10 | 0130 |
| Beginning Time | Ending Time | ||
|---|---|---|---|
| Day/Month | HKT | Day/Month | HKT |
| 28 / 8 | 0645 | 4 / 9 | 1620 |
| Beginning Time | Ending Time | ||
|---|---|---|---|
| Day/Month | HKT | Day/Month | HKT |
| 15 / 9 | 1400 | 15 / 9 | 1610 |
| Meteorological Element | Figure of the Month | Departure from Normal* |
|---|---|---|
| Mean Daily Maximum Air Temperature | 31.2 degrees C | 1.1 degrees above normal |
| Mean Air Temperature | 28.4 degrees C | 0.7 degree above normal |
| Mean Daily Minimum Air Temperature | 26.6 degrees C | 0.8 degree above normal |
| Mean Dew Point Temperature | 25.3 degrees C | 1.9 degrees above normal |
| Mean Relative Humidity | 84 % | 6 % above normal |
| Mean Cloud Amount | 78 % | 12 % above normal |
| Total Rainfall | 708.8 mm | 381.2 mm above normal |
| Number of hours of Reduced VisibilityΔ | 14 hours | 59.2 hours below normal§ |
| Total Bright Sunshine Duration | 131.3 hours | 41.0 hours below normal |
| Mean Daily Global Solar Radiation | 13.30 Megajoule / square metre | 1.31 Megajoule below normal |
| Total Evaporation | 74.2 mm | 51.7 mm below normal |
| Remarks : | All measurements were made at the Hong Kong Observatory except sunshine, solar radiation and evaporation which were recorded at King's Park Meteorological Station and visibility which was observed at the Hong Kong International Airport. |
| Δ |
The visibility readings at the Hong Kong International Airport are based on hourly observations by professional meteorological observers in 2004 and before, and average readings over the 10-minute period before the clock hour of the visibility meter near the middle of the south runway from 2005 onwards. The change of the data source in 2005 is an improvement of the visibility assessment using instrumented observations following the international trend. |
* Departure from 1981 - 2010 climatological normal, except for number of hours of reduced visibility |
|
§ Departure from mean value between 1997 and 2019 |
|


| Remarks : | Extremely high: above 95th percentile Above normal: between 75th and 95th percentile Normal: between 25th and 75th percentile Below normal: between 5th and 25th percentile Extremely low: below 5th percentile Percentile and 5-day running average values are computed based on the data from 1981 to 2010 |
